

This section of the user guide is focused on User Feedback Analytics. To help you navigate the article we have broken it down into the following sections:
- What are user feedback analytics?
- Who can view user feedback?
- How can I view user feedback Analytics?
- Filtering User Feedback Analytics
- User Feedback Analytics
- Exporting User Feedback Analytics
What are user feedback analytics?
User feedback analytics allow users to view virtual assistant user feedback to maintain and enhance the user experience with the virtual assistant. The user feedback analytics page provides a broad overview of the performance of your virtual assistant user experience with the ability to drill down and view more specific feedback on individual questions. This enables you to review the feedback to determine if the content needs to be updated.
Note: This is an optional feature that has to be enabled. To enable this feature, review the Behavior Settings: User Feedback article.

If the user feedback settings have not been enabled, the following message will display.

Who can view user feedback?
Analytics is available to individuals with the following permissions:

For more information on user permissions, review the User Roles & Permissions article.How can I view user feedback Analytics?
Under the Virtual Assistant section, select User Feedback Analytics.

Filtering User Feedback Analytics
User feedback can be filtered by Office, Language, AI Departmental Model, and Response Type.

The date range can be filtered by yesterday, last week, last 15 days, last month, last year, or a custom range. The date range will default to last month.

User Feedback Analytics
The User Feedback Analytics page is broken down into multiple sections:
- Net Sentiment Score
- Net Sentiment Trend
- Feedback Per Day/Month/Year
- Interactions Feedback by Day/Week/Hour
- Best Performing Responses
- Lowest Performing Responses
Interactions Feedback
The interactions Feedback section can be toggled between Feedback Offered and All Interactions.
- Positive - The Feedback Offered chart, provides a percentage of all positive interactions where feedback was offered. The All Interactions chart provides a percentage of all positive interactions where feedback could have been offered. A View All link is provided for Virtual Assistant - Administrator and Virtual Assistant - Standard users to a filtered interactions page of all positive interactions within the filtered timeframe.
- The Feedback Offered chart provides a percentage of all negative interactions where feedback was offered. The All Interactions chart provides a percentage of all negative interactions where feedback could have been offered. A View All link is provided for Virtual Assistant- Administrator and Virtual Assistant - Standard users to a filtered interactions page of all negative interactions within the filtered timeframe.
- Comments - Provides the total number of comments during the filtered timeframe. A View All link is provided for Virtual Assistant - Administrator and Virtual Assistant - Standard users to a filtered interactions page of all interactions with a comment within the filtered timeframe.
To the right, a pie chart will show the total interactions where feedback was offered or all interactions. The All Interactions pie chart will include a not-offered segment.
Net Sentiment Score
The sentiment score for all interactions is based on the filtered time range.
- The net sentiment score:
- Net Sentiment Score = total positive interactions - total negative interaction / total interactions (rounded to the nearest whole number).
- Total interactions are calculated by adding the positive, negative, and neutral interactions. Neutral interactions are interactions where user feedback was offered, but not completed.
- Any score that leans positive is good.
- Net Sentiment Score = total positive interactions - total negative interaction / total interactions (rounded to the nearest whole number).
Net Sentiment Trend
- Tracks the calculated net sentiment score over time
- If you hover over each point it will display the date and the net sentiment score.
Feedback Per Day/Month/Year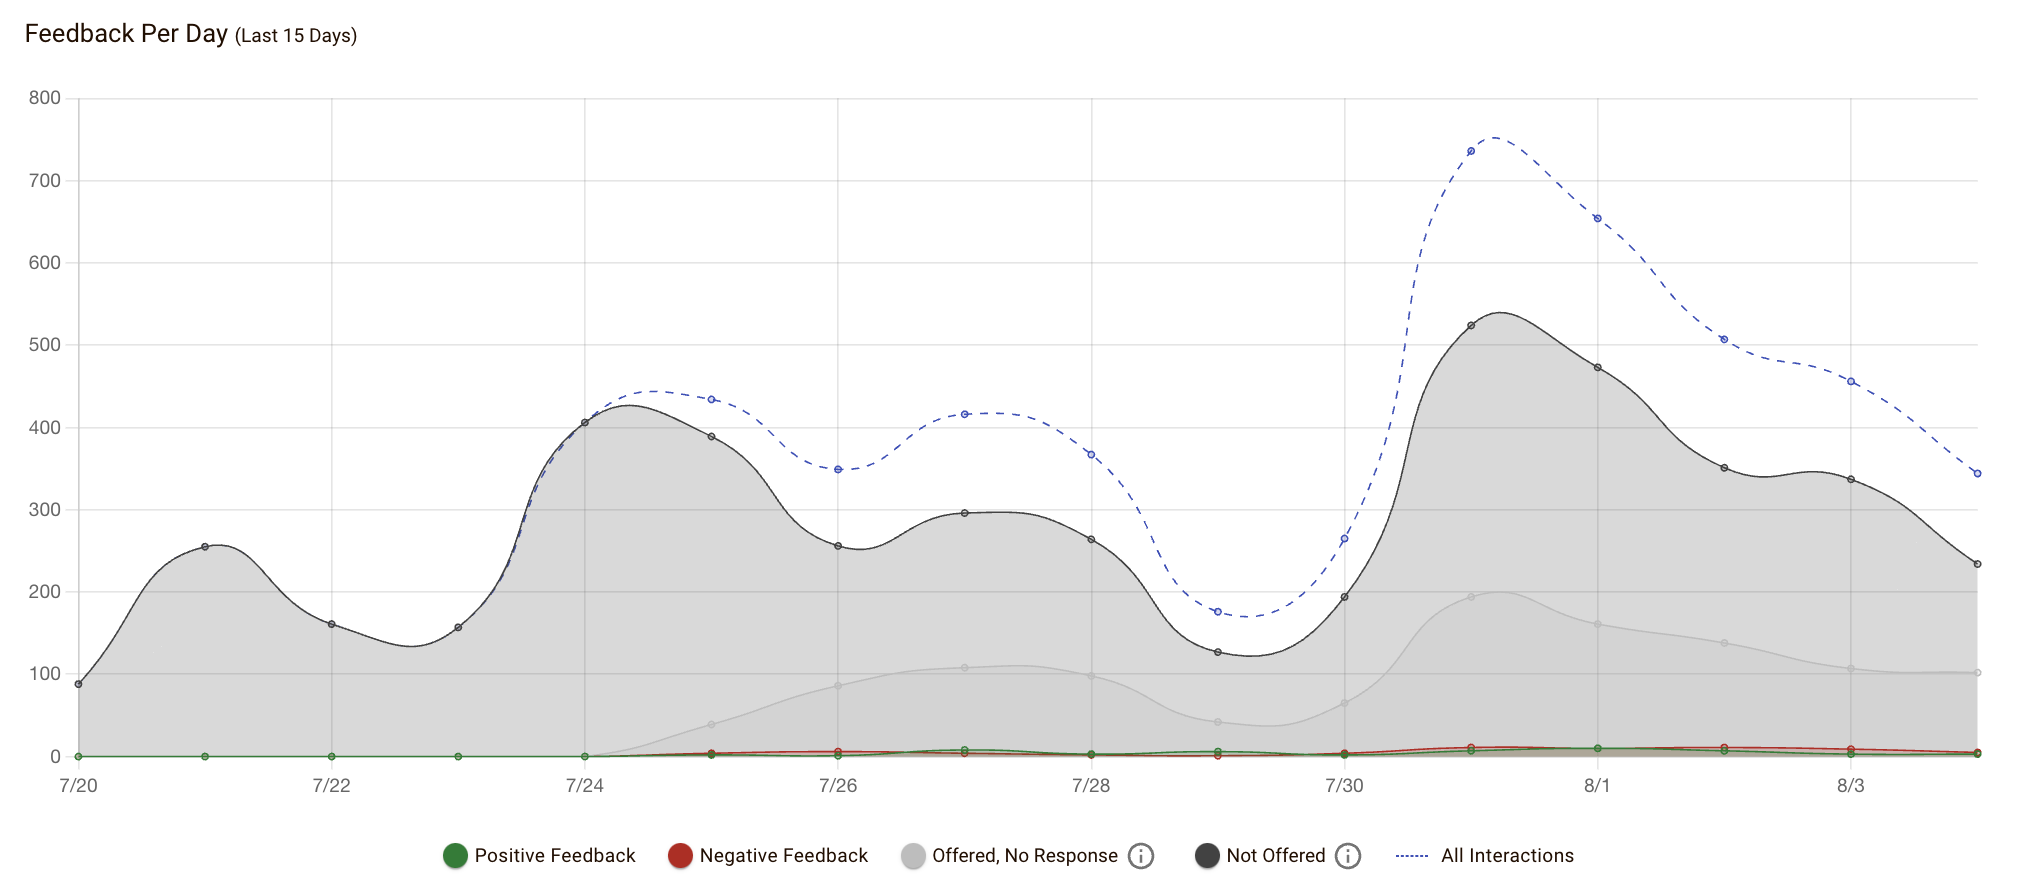
- The chart will adjust based on the filtered timeframe to per day, month, or year.
- The chart reflects all four types of interactions, positive, negative, offered - no response, not offered, and an all interactions line as reference. Individual values can be selected to include or exclude on the graph.
Interactions Feedback by Day/Week/Hour
- A toggle is available in the top right-hand corner of the graph to select day, week, or hour depending on the filtered timeframe.
- The chart reflects all four types of interactions, positive, negative, offered - no response, not offered, and an all interactions line as reference. Individual values can be selected to include or exclude on the graph.
Best Performing Responses
- Lists the top responses with the highest positive feedback.
- The questions are ranked by the percentage of positive feedback.
- The percentage of positive and negative feedback is displayed next to each question.
- The question is hyperlinked to the filtered General Library or Custom Questions page for the question.
- There must be at least 5 interactions within the applied filters for the question analytics to appear in this section.
Lowest Performing Responses
- Lists the top responses with the lowest negative feedback.
- The questions are ranked by the percentage of negative feedback.
- The percentage of positive and negative feedback is displayed next to each question.
- The question is hyperlinked to the filtered General Library or Custom Questions page for the question.
- There must be at least 5 interactions within the applied filters for the question analytics to appear in this section.
Exporting User Feedback Analytics
To export user feedback analytics select the desired date range and other filter options as needed, then select export .

Your analytics report will be sent to the email address associated with your account as a .csv file.

Was this article helpful?
That’s Great!
Thank you for your feedback
Sorry! We couldn't be helpful
Thank you for your feedback
Feedback sent
We appreciate your effort and will try to fix the article