

This section of the user guide is focused on knowledge base analytics. To help you navigate the article we have broken it down into the following sections:
- What are knowledge base analytics?
- Who can view knowledge base analytics?
- How do I view knowledge base analytics?
- Exporting Analytics
What are knowledge base analytics?
Analytics are available on all individual knowledge base questions (both general library and custom questions). The analytics can be viewed on the Edit or View modal of a question in the General Library, Custom Questions, or Awaiting Review pages of the admin portal. Additionally, a comprehensive view of the analytics for multiple questions can be found in the General Library and Custom Questions export file.
Who can view knowledge base analytics?
Knowledge base analytics are available to individuals with the following permissions:

For more information on user permissions, review the User Roles & Permissions article.How do I view knowledge base analytics?
To view the interactions, from the General Library, Custom Questions, or Awaiting Review page, select the dropdown next to the question and select View or Edit button (only Virtual Assistant Administrator and Virtual Assistant Standard users have the Edit option available to them).

Select the Analytics tab. Interactions can be filtered by a date range.
 The following analytics are available for each knowledge base question:
- Interactions/Feedback (All-Time)
- Interactions/Feedback [Date range]
- Interactions per Hour/Day/Month/Year [Date range] Graph
- Interactions by Day/Hour Graph
- Feedback per Day/Month/Year
- Feedback by Day/Hour
Interactions/Feedback (All-Time) 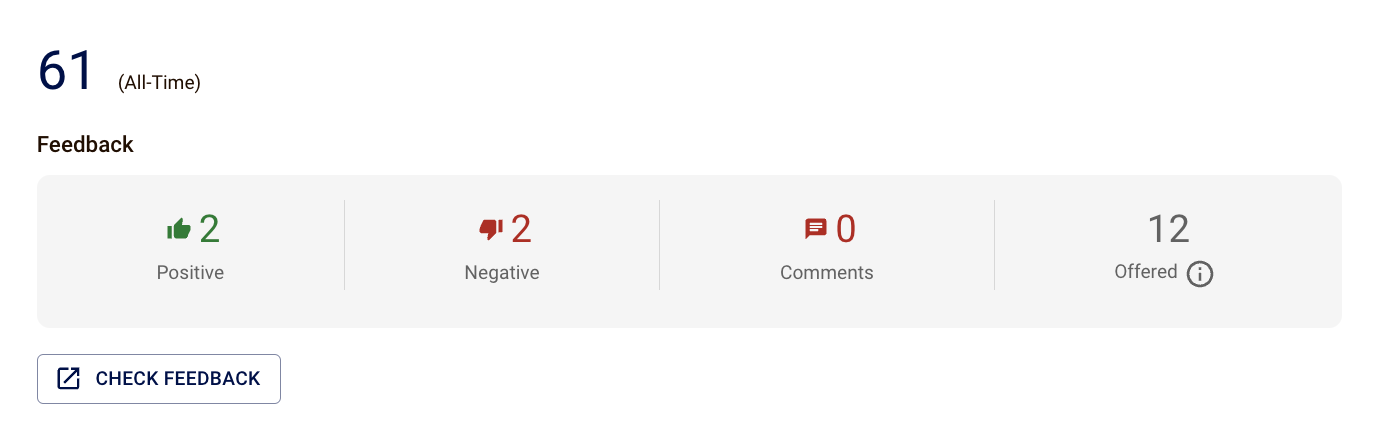
- The top number displays the number of times the question has ever been asked.
- Underneath displays the all-time feedback for the question. This includes the number of positive and negative feedback, the total number of comments, and the number of times feedback has been offered to the virtual assistant user.
- Select the Check Feedback button to be navigated to a pre-filtered interactions page of all interactions for the question.
Interactions/Feedback [Date range]

- The top number displays the number of times the question has ever been during the filtered timeframe.
- Underneath displays the feedback for the filtered timeframe for the question. This includes the number of positive and negative feedback, the number of comments, and the number of times feedback has been offered to the virtual assistant user.
- Select the Check Feedback button to be navigated to a pre-filtered interactions page of all interactions for the question during the filtered timeframe.
Interactions per Hour/Day/Month/Year [Date range] Graph
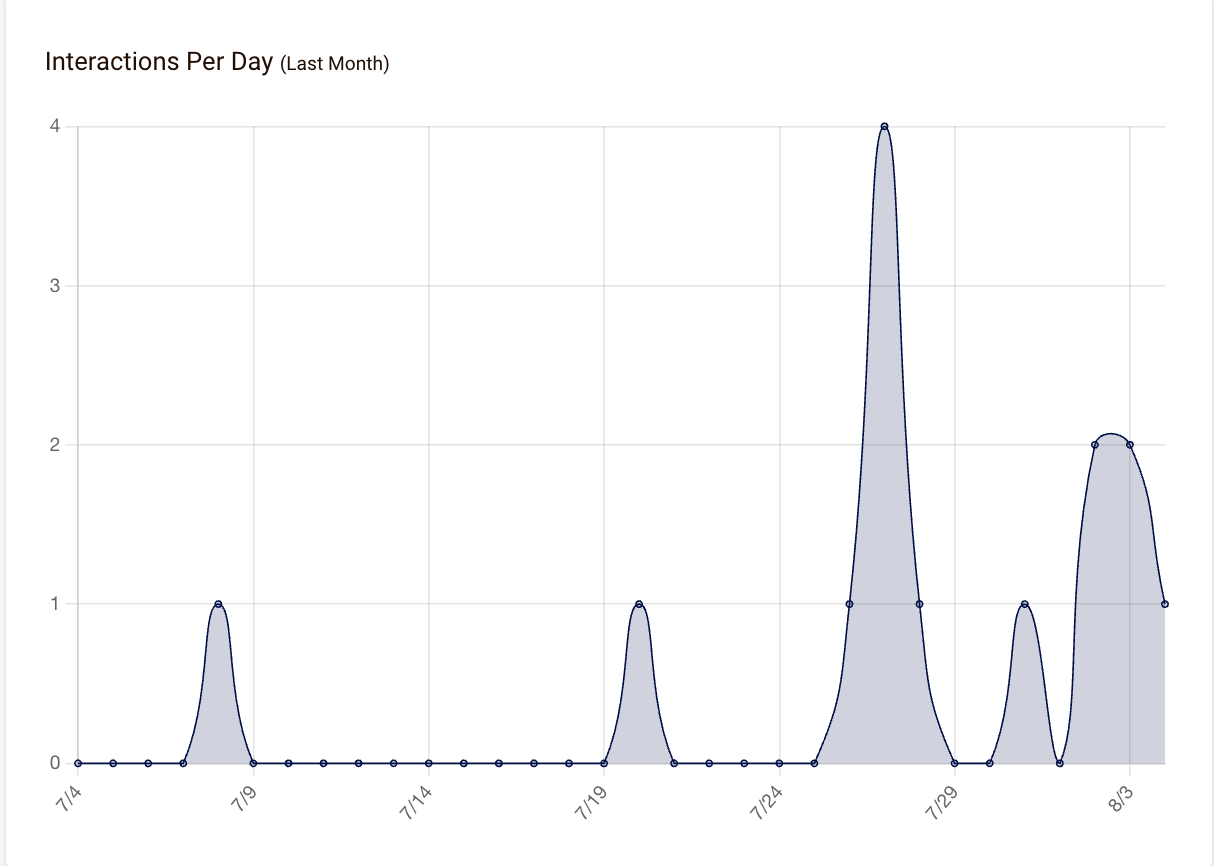
- The graph visually displays the number of times the question was asked dynamically based on the filtered date range.
- A filtered date range of one day will display Interactions Per Hour.
- A filtered date range of more than one day but less than two months will display Interactions Per Day.
- A filtered date range of more than two months but less than two years will display Interactions Per Month.
- A filtered date range of more than two years will display Interactions Per Year.
Interactions by Day/Hour Graph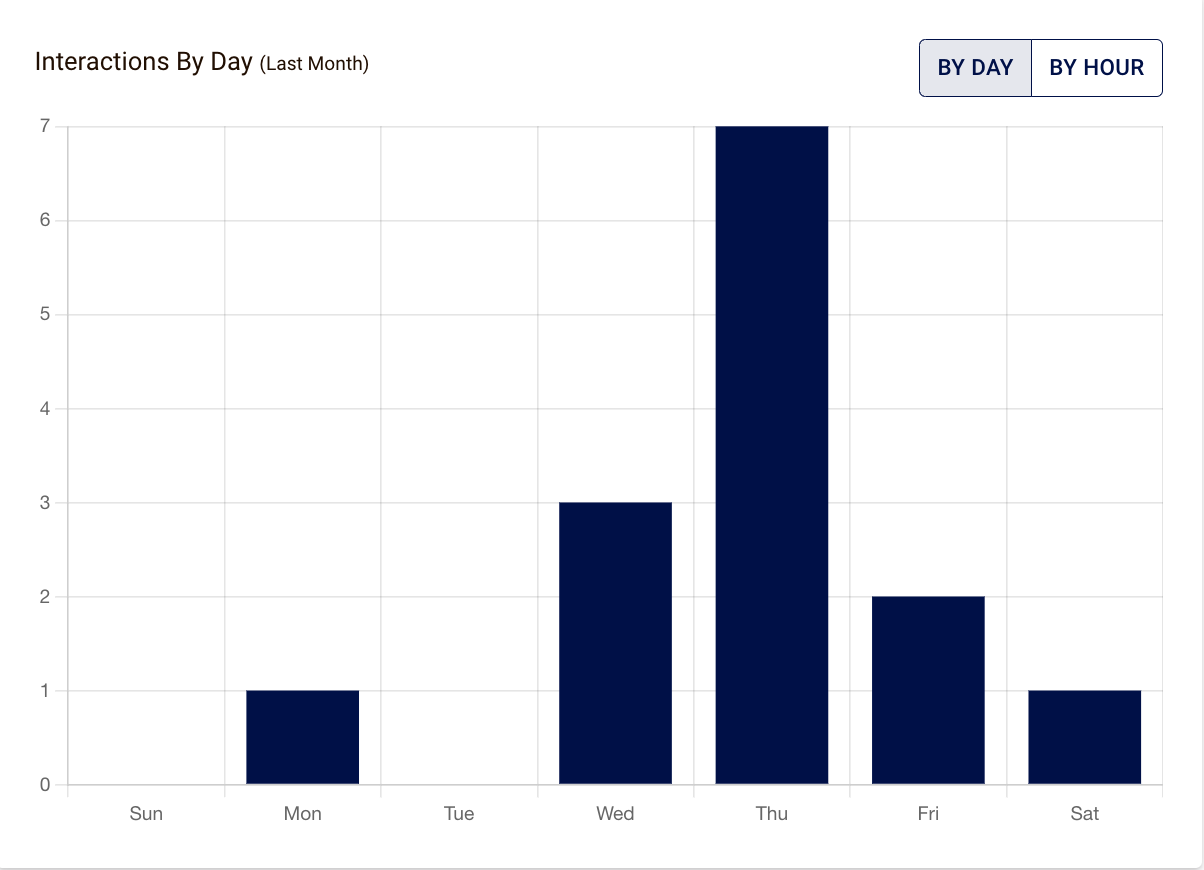
- This graph visually displays the total number of times the question was asked on each day or hour of the week based on the filtered date range.
- There is a toggle in the top right-hand corner of the chart to view interactions by day or by hour.
Feedback per Day/Month/Year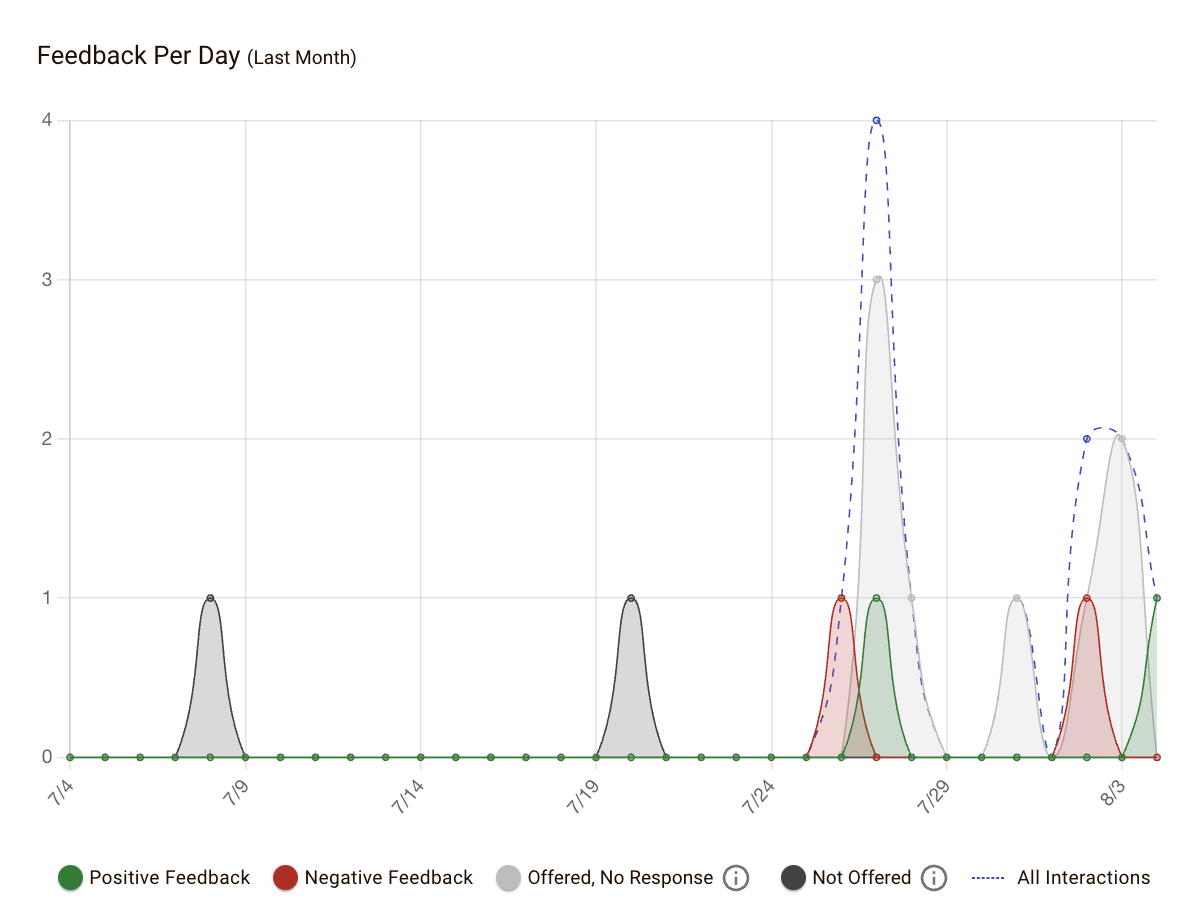
- The chart will adjust based on the filtered timeframe to per day, month, or year.
- The chart reflects all four types of interactions for the question, positive, negative, offered - no response, not offered, and an all interactions line as reference. Individual values can be selected to include or exclude on the graph.
Feedback by Day/Hour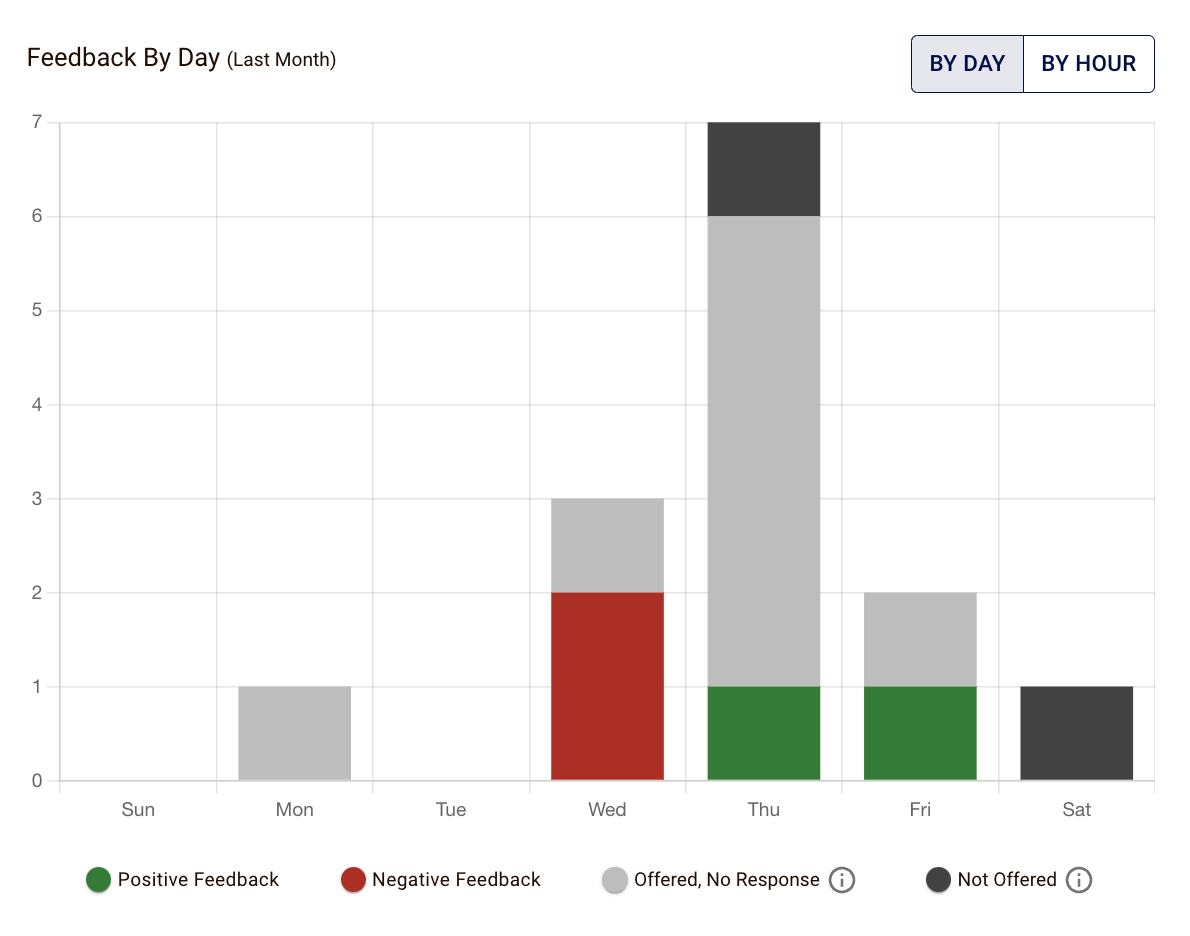
- A toggle is available in the top right-hand corner of the graph to select by day or by hour.
- The chart reflects all four types of interactions, positive, negative, offered - no response, and not offered. Individual values can be selected to include or exclude on the graph.
Exporting Analytics
General library exports will only include your top 25 most frequently asked questions (respective of filters). To export your top 25 most frequently asked questions select the desired filter options as needed, then select export.


To export all custom question analytics select the knowledge base dropdown then select custom questions.

Once you select export two options will appear. Select your desired option and the date range, then select export.


The green notification in the bottom left will indicate that your report is being generated. The report will be sent to your account's email address as a .csv file.

To export analytics for an individual or custom question, select the dropdown next to the question then select view.

Select the Analytics tab, then select Export.

Was this article helpful?
That’s Great!
Thank you for your feedback
Sorry! We couldn't be helpful
Thank you for your feedback
Feedback sent
We appreciate your effort and will try to fix the article